gmaps
Google maps in Jupyter notebooks
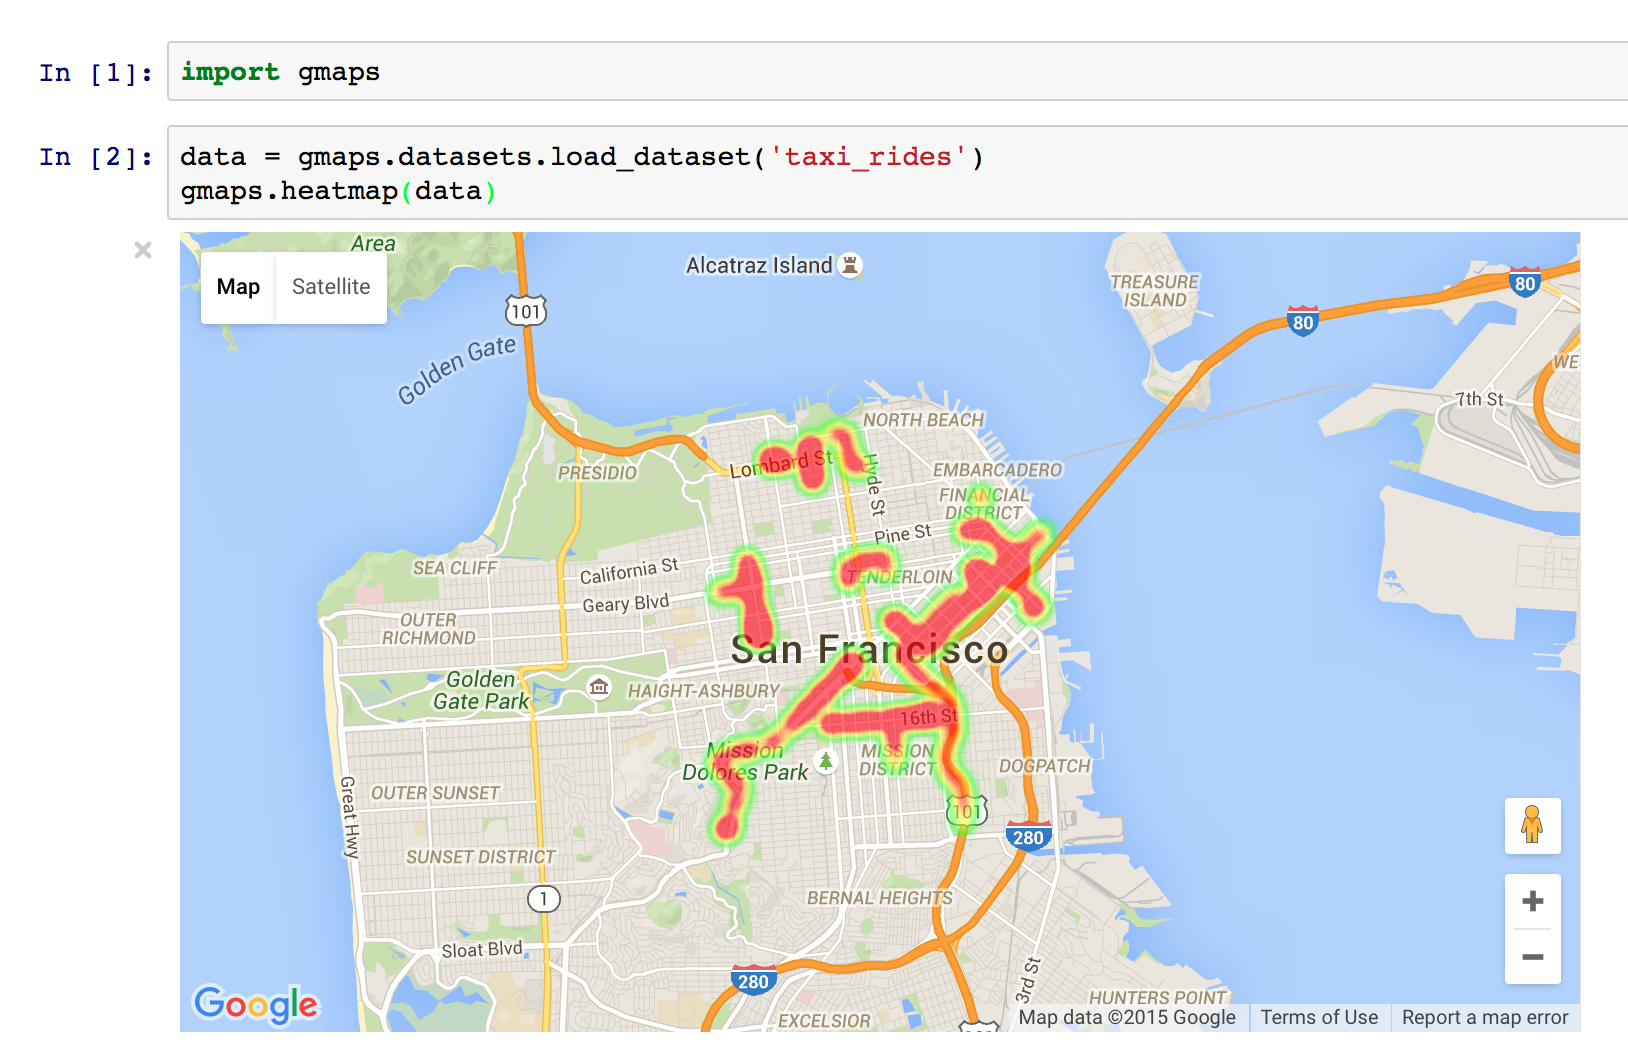
You have some latitude and longitude data in a Python list, a numpy array or a pandas dataframe. You want to see where that data is. This plugin for Jupyter makes that easy.
Visualize your data using heatmaps or symbols and overlay it with GeoJSON.
gmaps has been downloaded over 250,000 times using conda alone. It has over 700 stars on GitHub.
Dash Bootstrap components
Responsive layouts and components for Plotly Dash
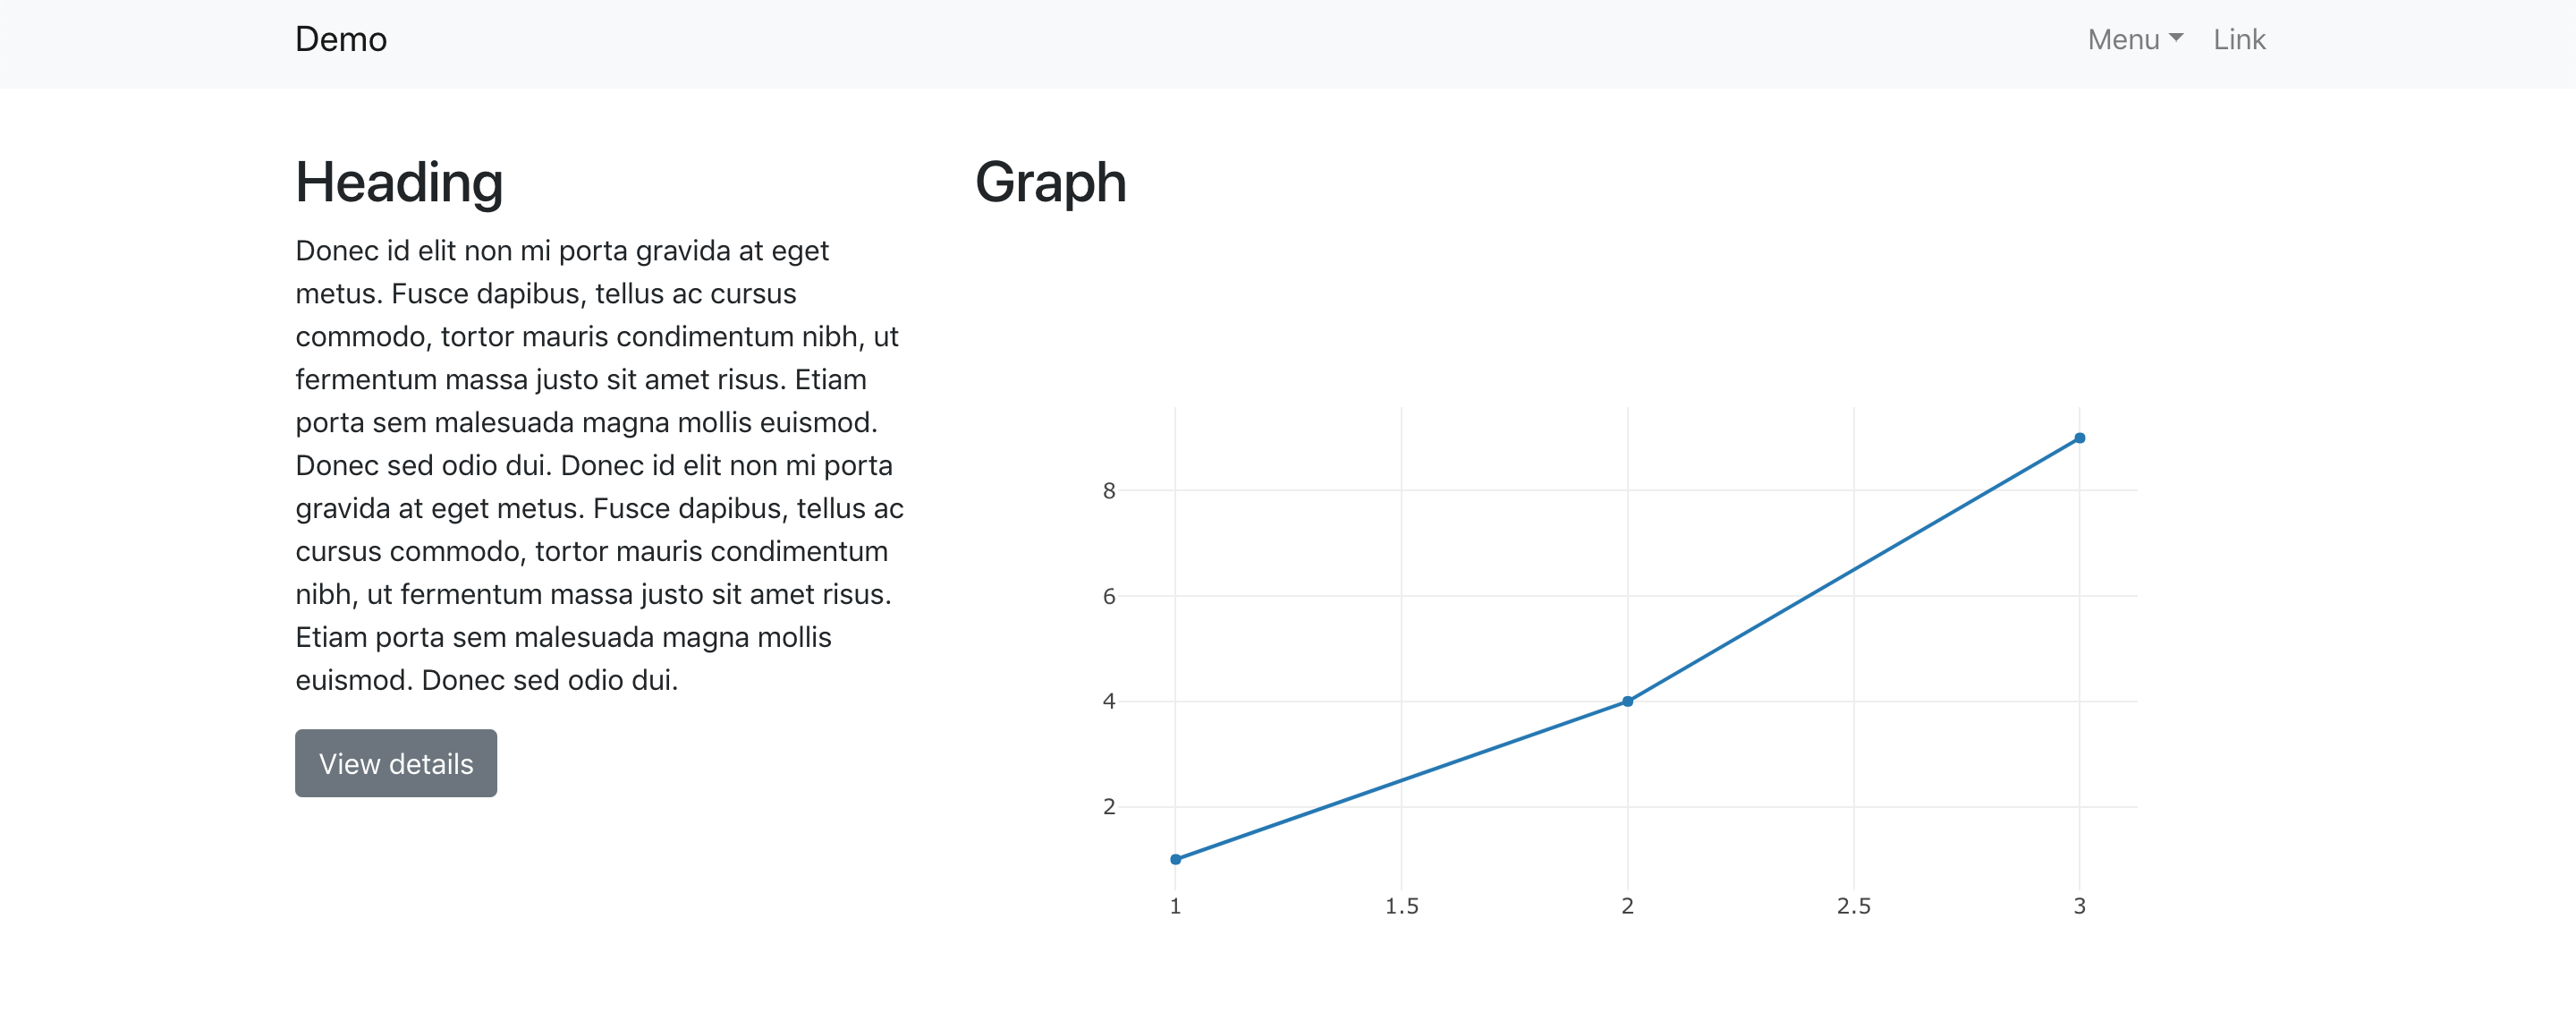
Dash Bootstrap components makes it easy to structure and build your Plotly Dash applications by providing layouts and high-level components that wrap Twitter Bootstrap. It allows data scientists to build engaging, responsive dashboards without worrying about the details of CSS and styling.
I work on Dash Bootstrap components with Tom Begley.
jupyterlab-sql
A SQL GUI in JupyterLab
jupyterlab-sql is a JupyterLab plugin that adds a GUI for viewing SQL tables and interactively composing queries. It can be used alongside a notebook or an editor for quickly iterating over SQL queries.
Faculty Platform
A data science workbench for teams
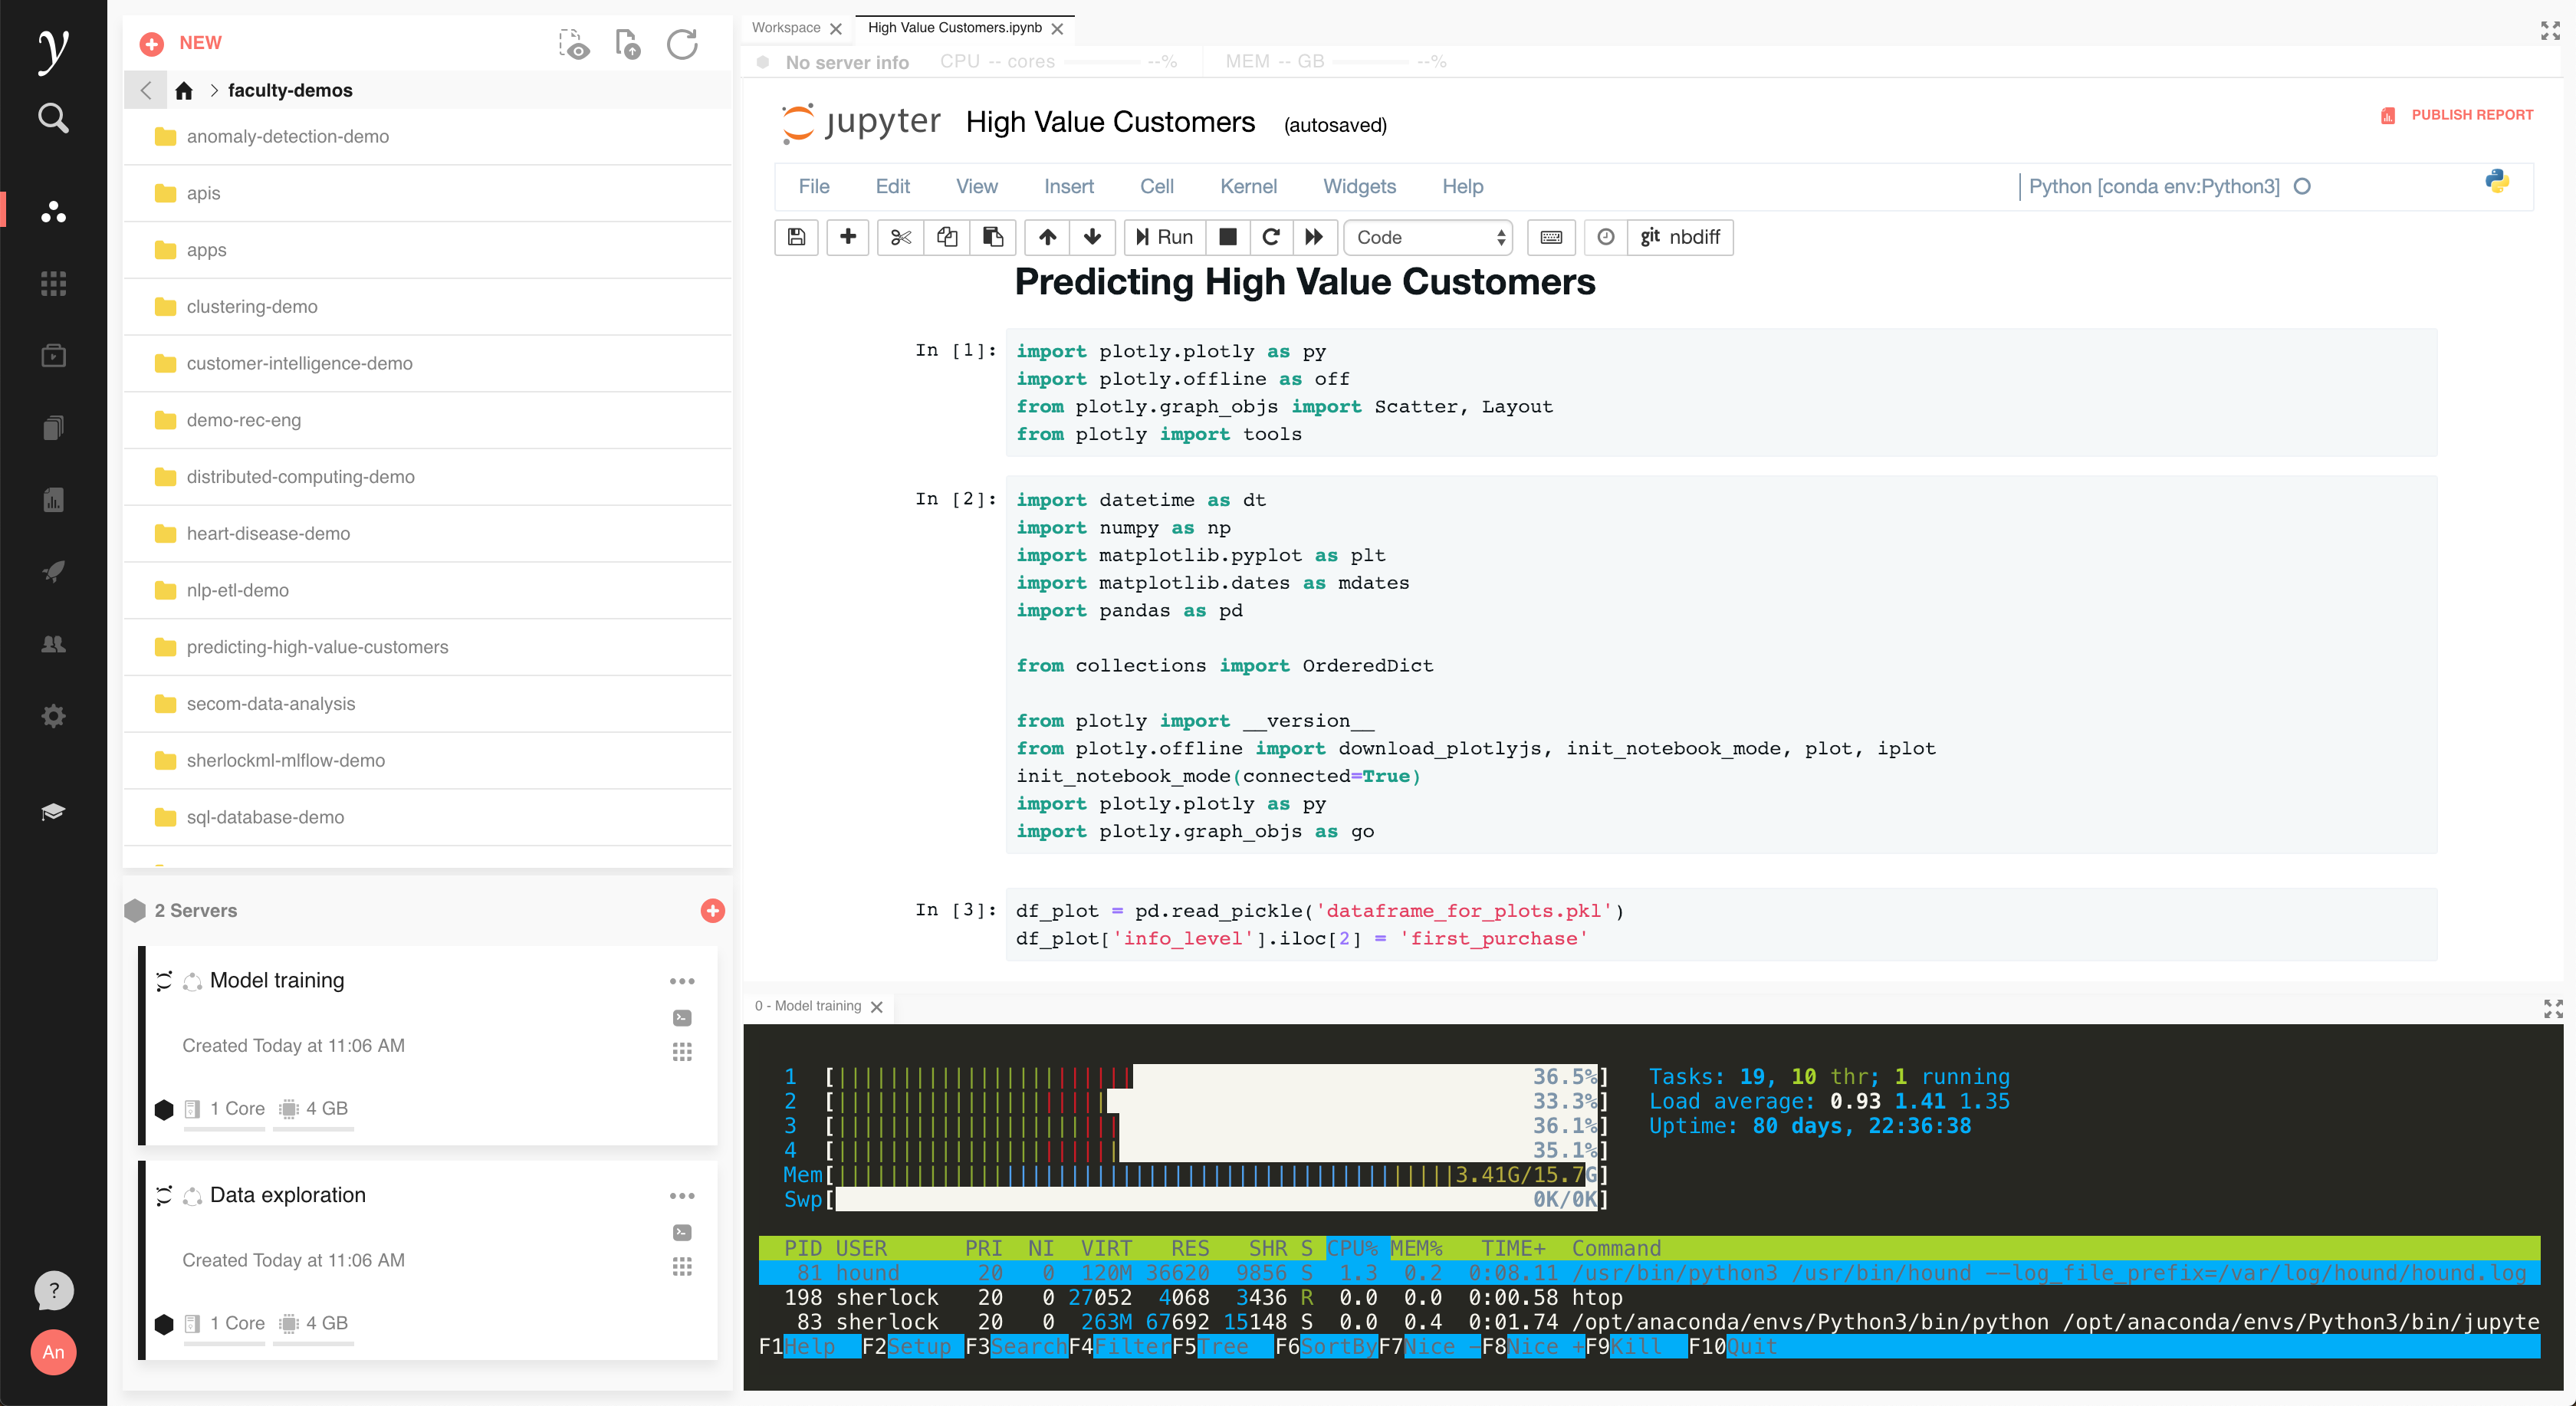
Faculty platform aims to be the place in which data science is done for teams. By creating a shared execution environment in which data scientists can operate in, as well as a place to host models and keep track of experiments, it reduces the friction associated with the operation of a data science team.
It is typically deployed inside an organisation's infrastructure, allowing data scientists to access databases behind corporate firewalls.
Faculty platform is powered by open source tools, such as the Jupyter ecosystem, MLFlow, and Plotly Dash.
Faculty Platform is developed by Faculty. I work predominantly on backend application code and the infrastructure layer. I also have technical lead and, occasionally, product ownership responsibilities. As the first engineer to work on the platform team, I have guided the growth and development of the platform since its inception.
Jupyter widgets
Interactive visualizations in Jupyter notebooks
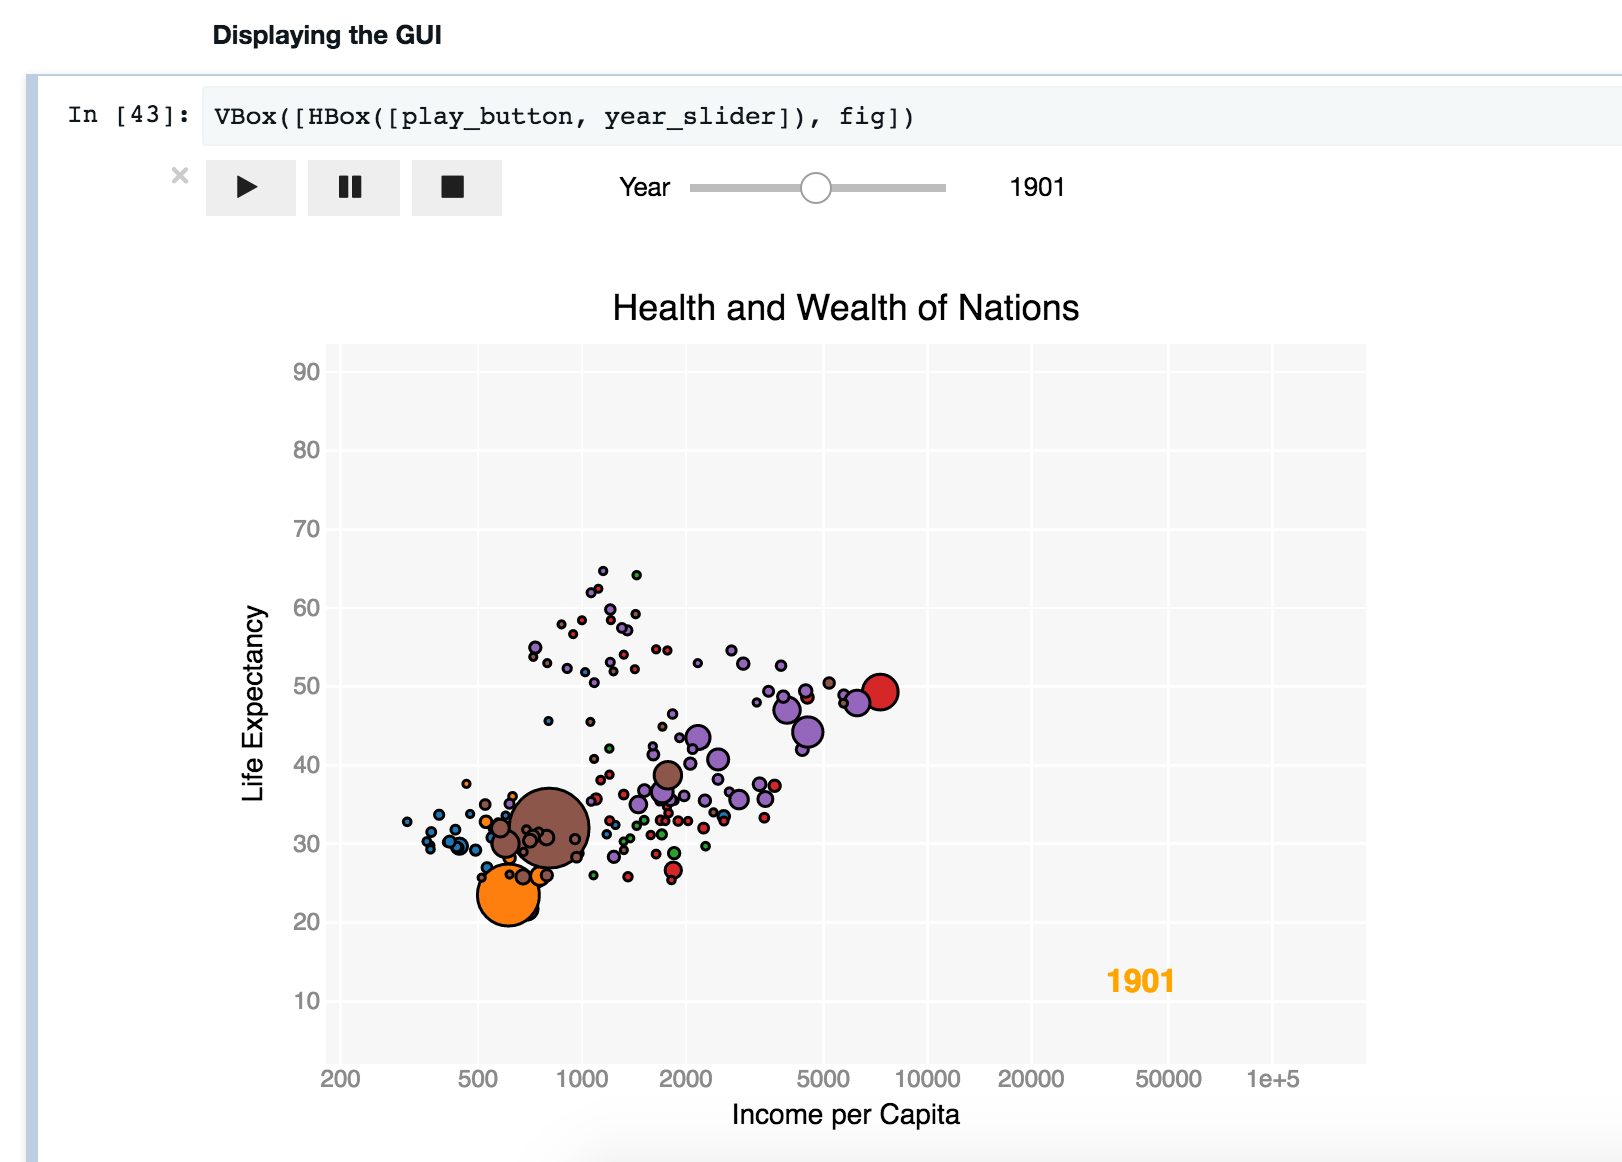
Jupyter widgets let you build interactive data visualizations and graphical user interfaces in Jupyter notebooks. Widgets can be inserted into a data processing pipeline to understand data flows. This lets the data scientist explore the data interactively, leading to a shorter feedback loop.
Jupyter widgets are an important part of the Jupyter ecosystem. They have been developed alongside Jupyter notebooks, with many of the same contributors.
I started contributing regularly to the development effort in May 2017, and was granted commit rights in July of the same year.